Lesson 1.5 Developing Backend 3rd Party APIs with analysis and cleaning Python, Flask, Pandas
Key Topics:
- 3rd Party APIs
- Analysis and Cleaning using Python, Flask, and Pandas
3rd Party APIs
What are 3rd Party APIs?
- 3rd Party APIs are application programming interfaces that are created by third-party developers or companies
- 3rd Party API’s allow developers to save time and resources by not having to make the API’s by themselves
- There are security risks with using less popular 3rd party APIs
- Developers should ensure that they are secure and reliable before integrating them into their applications
Some popular API’s
- Rapid API
- Github Public APIs
- Google Maps API
- Twitter API
- Facebook API
- etc
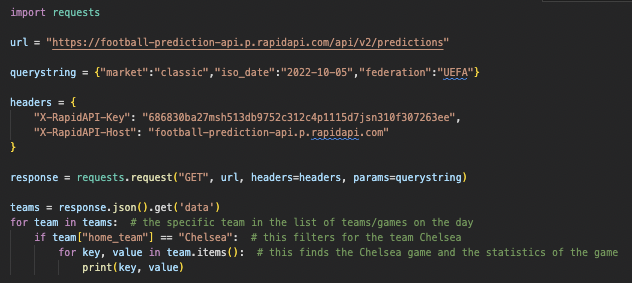
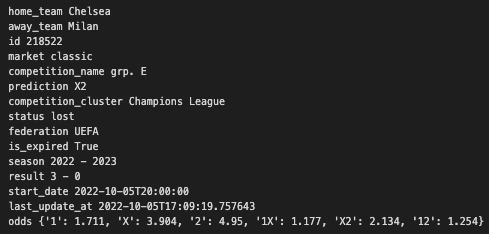
Example 1 (Python)
Example 2 (Javascript)
fetch('https://api.covid19api.com/summary')
    .then(response => response.json())
    .then(data => {
      const tbody = document.querySelector('#myTable tbody');
      data.Countries.forEach(country => {
        const row = document.createElement('tr');
        row.innerHTML = `
          <td>${country.Country}</td>
          <td>${country.TotalConfirmed}</td>
          <td>${country.TotalDeaths}</td>
        `;
        tbody.appendChild(row);
      });
    })
    .catch(error => console.error(error));
| Country | Cases | Deaths |
|---|
Analysis and Cleaning using Python, Flask, and Pandas
What is Analysis and Cleaning?
- Data cleaning is the process of fixing or removing incorrect, corrupted, incorrectly formatted, duplicate, or incomplete data within a dataset
- Allows for accurate, reputable, organized data that generates a reliable representation of whatever it is that will be put through data analysis
Pandas
- Pandas is a package, which contains functions mainly used for data analysis, cleaning, and manipulation
- Pandas uses other Python libraries such as NumPy, Scikit-learn, and TensorFlow
| Function | Purpose |
|---|---|
| head() | Returns the first n rows of a DataFrame |
| tail() | Returns the last n rows of a DataFrame |
| read_csv() | Reads a CSV file into a Pandas DataFrame |
| dropna() | Removes rows with null values |
| merge() | Merges two DataFrames based on a specified column |
| sort_values() | Sorts a DataFrame by a specified column |
| describe() | Generates descriptive statistics of a DataFrame |
| scatter() | Create a scatter plot of DataFrame data |
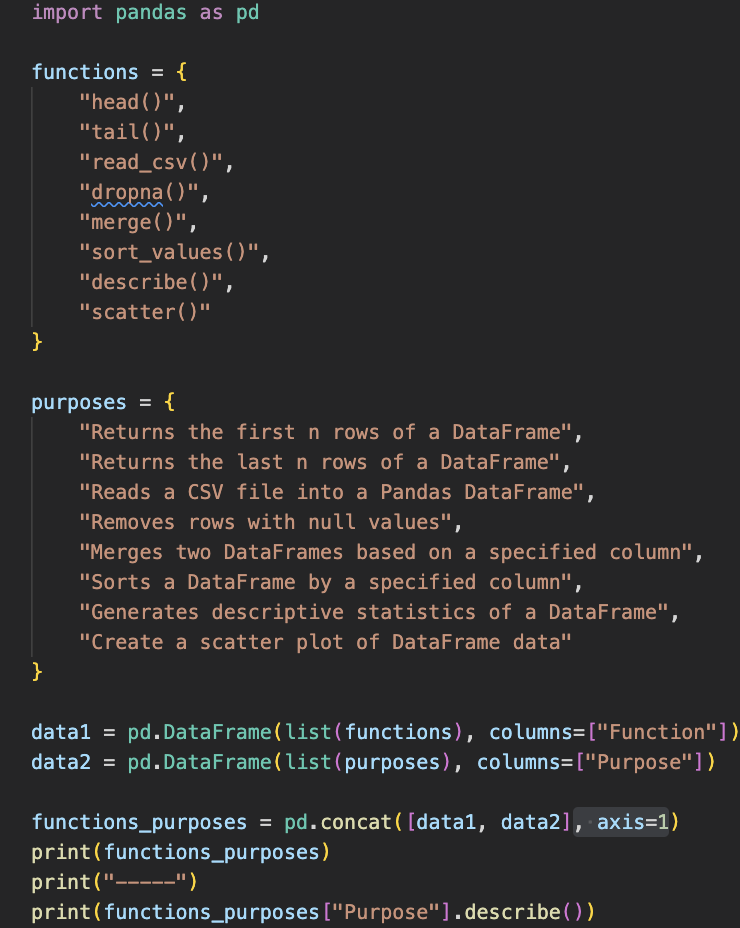
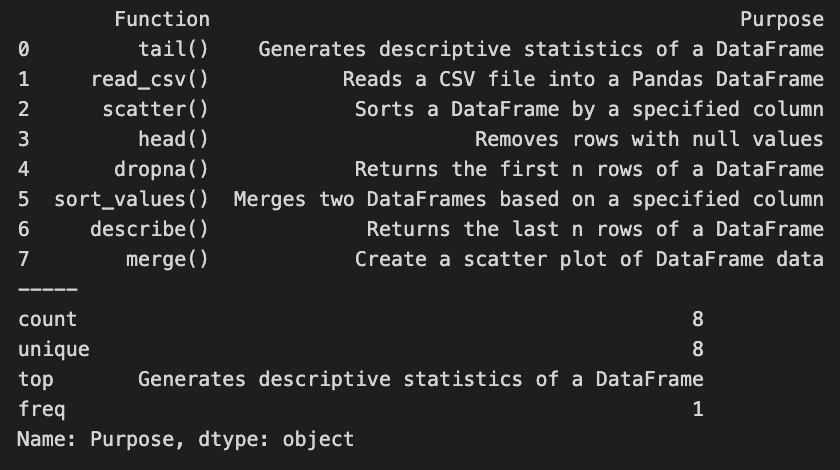
Example 1
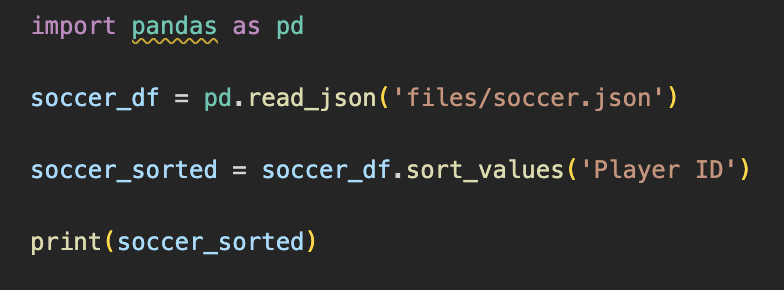
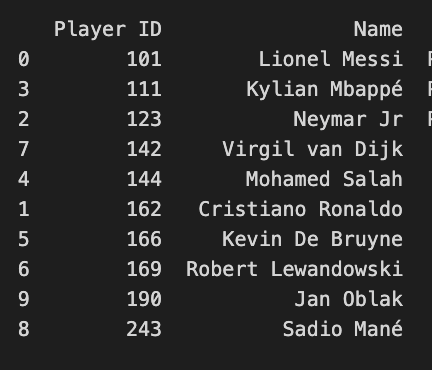
Example 2
Json file:
{
    "Player ID": {
        "0": 101,
        "1": 102,
        "2": 103,
        "3": 104,
        "4": 105,
        "5": 106,
        "6": 107,
        "7": 108,
        "8": 109,
        "9": 110
    },
    "Name": {
        "0": "Lionel Messi",
        "1": "Cristiano Ronaldo",
        "2": "Neymar Jr",
        "3": "Kylian Mbappé",
        "4": "Mohamed Salah",
        "5": "Kevin De Bruyne",
        "6": "Robert Lewandowski",
        "7": "Virgil van Dijk",
        "8": "Sadio Mané",
        "9": "Jan Oblak"
    },
}
Python code:
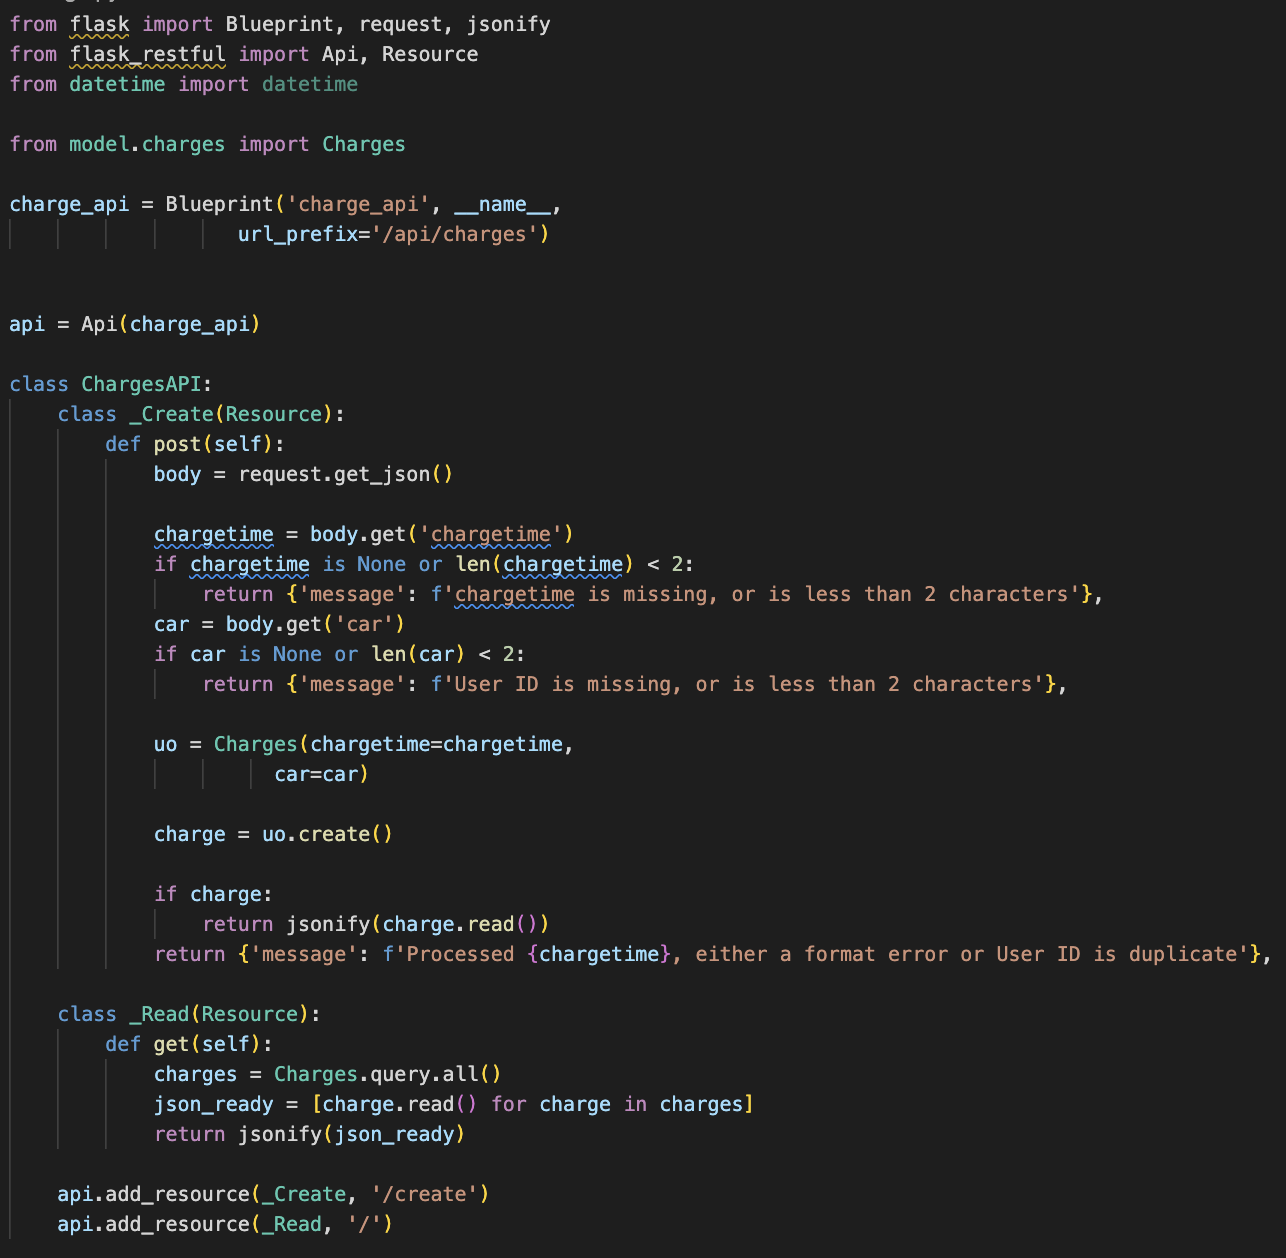
Flask
- Flask is a back-end framework
- This framework provides tools and libraries for building web applications, including URL routing, templating, request and response handling, and session management
- It is designed to be flexible and extensible, allowing developers to add functionality when needed
Example
Hacks
Choose from 1 of 2 of these hacks:
Option 1:
Find a third party api and display it in a table
Option 2:
Take this python table and use a minimum of 3 pandas functions to analyze the data
import pandas as pd
data = {
    'Name': ['Dillon', 'Noor', 'Steven', 'Lucas', 'Harsha', 'Varalu', 'Ryan', 'Emaad'],
    'Age': [24, 31, 42, 27, 29, 26, 90, 15],
    'Gender': ['M', 'M', 'M', 'M', 'F', 'F', 'F', 'F'],
    'Grade': ['A', 'B', 'A', 'D', 'C', 'F', 'B', 'A']
}
df = pd.DataFrame(data)
print(df)